This function provides access to the emm plots of a jamovi ANOVA object
Usage
get_emm_plot(jmv_result, plot_number = 1)
Arguments
- jmv_result
the result of a jmv::ANOVA call
- plot_number
the index of the emm plot to retrieve
Value
Returns a ggplot object
Examples
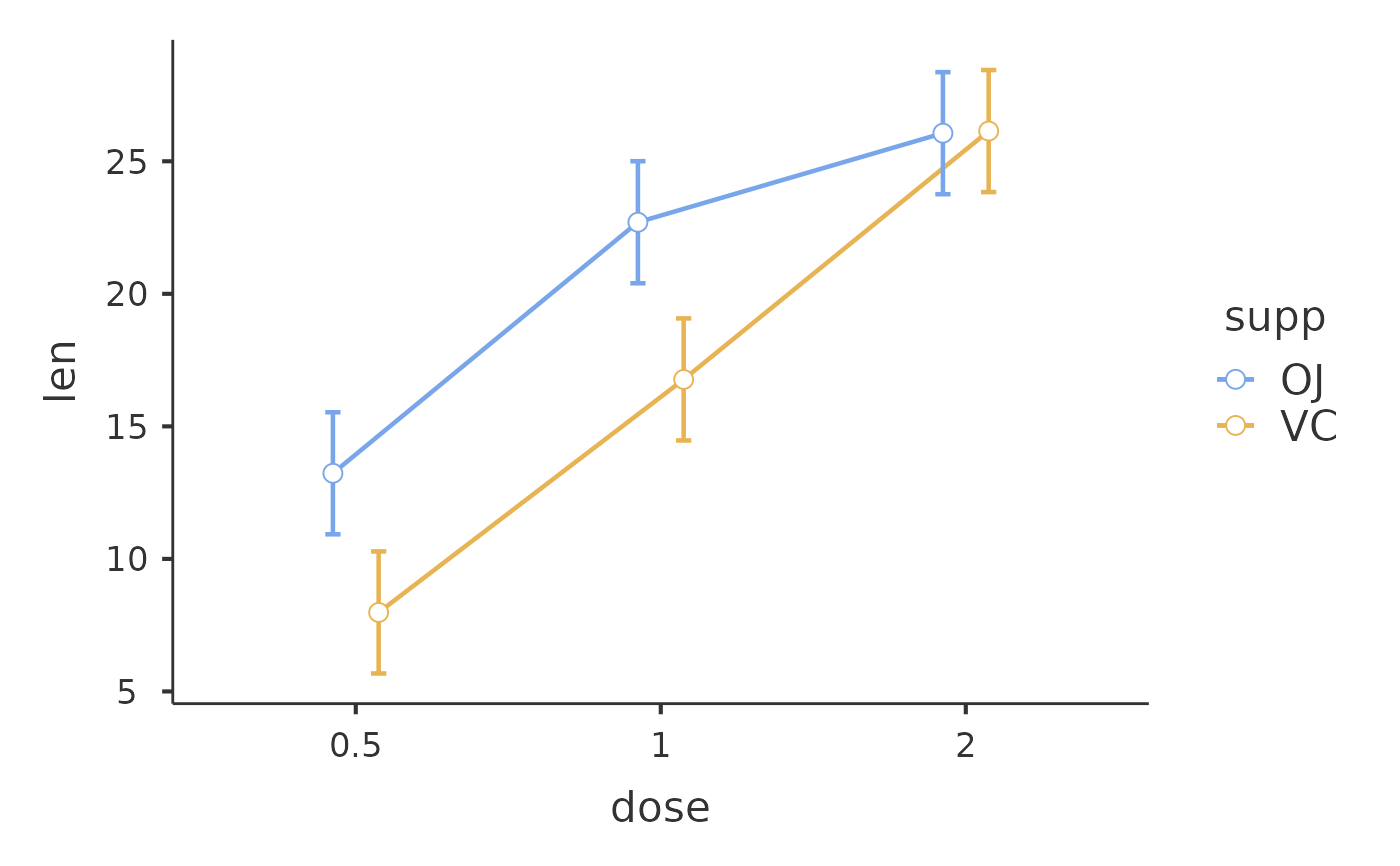
jmv_result <- jmv::ANOVA(
   data = ToothGrowth,
   dep = "len",
   factors = c("supp", "dose"),
   emMeans = list(
      c("dose", "supp"))
      )

get_emm_plot(jmv_result)